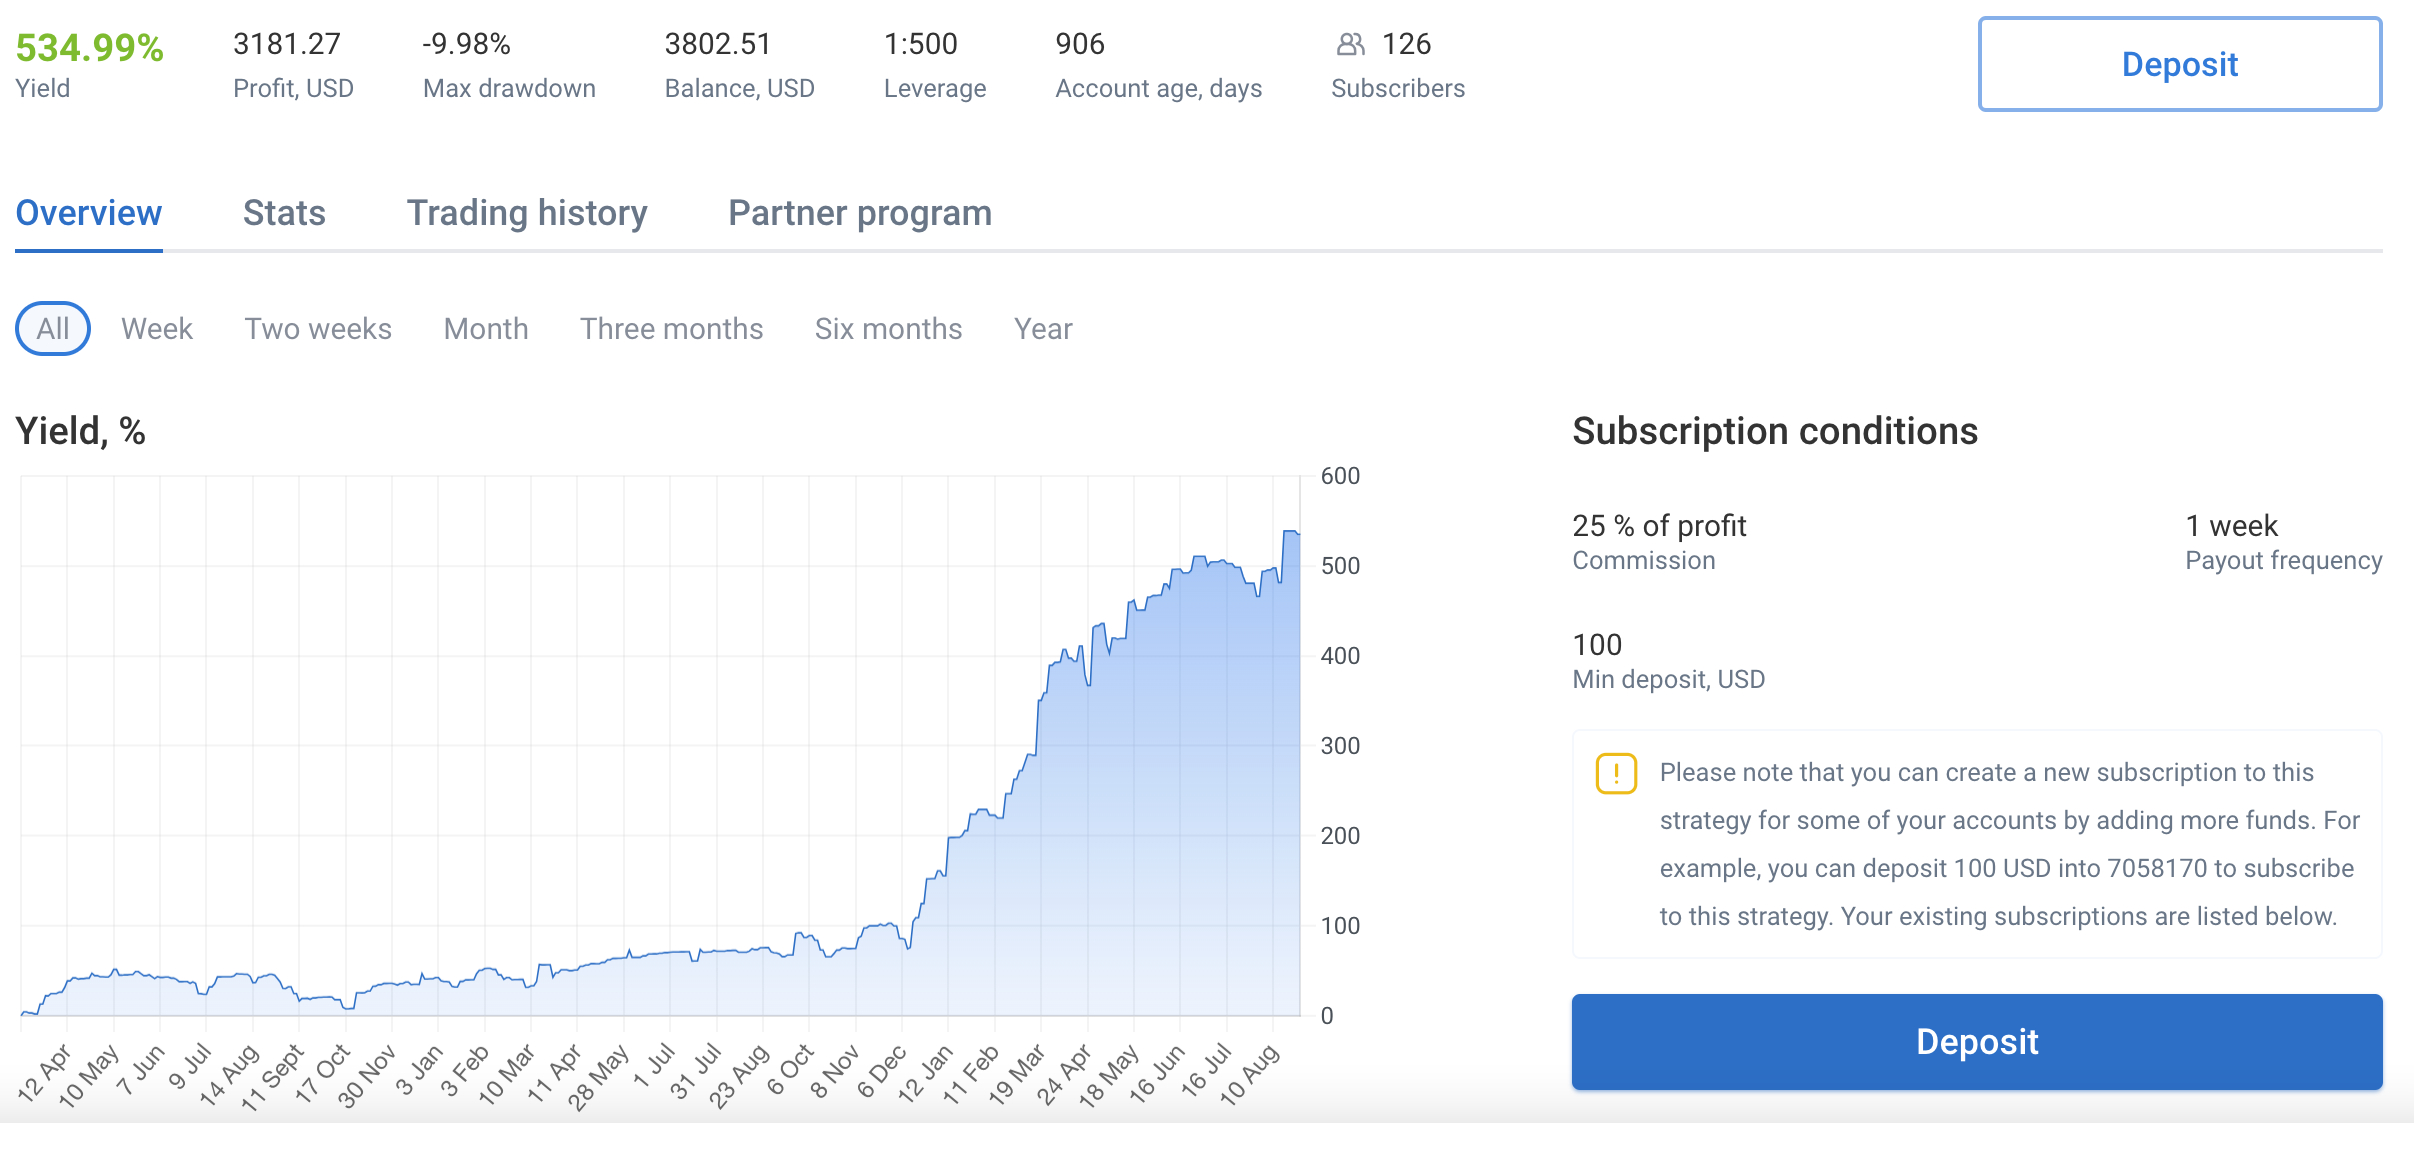
Knowing how to find profitable traders to copy is one of the most important parts of successful copy trading.
Most copy trading platforms make it easy to browse traders. You can usually see rankings, returns, follower numbers and other performance statistics within seconds.
The problem is that the trader with the highest return is not necessarily the best trader to copy.
A trader showing a 200% return might have used extreme leverage, suffered a 60% drawdown or relied on a strategy that could fail during a different market environment. Another trader might have generated 30% over several years with much lower drawdown and more consistent risk management.
For this reason, choosing a profitable trader should involve much more than looking at a leaderboard.
You need to understand how the trader generated the returns, how much risk was taken and whether the historical performance is consistent enough to provide useful information.
This guide explains what to look for when searching for profitable copy traders and which statistics can help you separate potentially sustainable strategies from traders who simply had an exceptionally good period.
What Makes a Trader Profitable?
Before looking for traders to copy, it is important to define what “profitable” actually means.
A profitable trader is not simply someone who had one successful month.
A stronger definition is a trader who has demonstrated the ability to generate positive returns over a meaningful period while maintaining a risk level that is appropriate for the strategy.
For example:
Trader A
- 250% return in six months
- 55% maximum drawdown
- High leverage
- Very aggressive position sizing
Trader B
- 45% return over three years
- 9% maximum drawdown
- Moderate leverage
- Consistent position sizing
Trader A generated the higher return.
But Trader B may provide a more sustainable risk profile.
This is why profitability needs to be evaluated together with risk and consistency.
Don’t Simply Choose the Top Trader
Most copy trading platforms display some form of ranking.
This can be useful for discovering traders, but it can also create a dangerous incentive to chase recent performance.
Imagine that a trader suddenly generates 80% in one month.
They move to the top of the leaderboard.
Thousands of users see the result and begin copying the strategy.
But what caused the performance?
Perhaps the trader:
- Used very high leverage
- Took concentrated positions
- Benefited from an unusual market movement
- Increased position sizes
- Took several exceptionally risky trades
A high return tells you what happened.
It doesn’t tell you why it happened.
Always investigate the underlying risk before copying a trader.
Start With the Track Record
One of the first things to check is how long the trader has been active.
A six-week track record provides very little information compared with several years of trading history.
A longer history allows you to see how the strategy behaved through different market environments.
Ideally, look for evidence across:
- Strong trends
- Sideways markets
- High volatility
- Low volatility
- Major economic events
- Bull markets
- Bear markets
A long track record doesn’t guarantee future profitability.
But it provides more data to analyze.
Look at Total Return
Total return is obviously important.
If you’re searching for profitable traders to copy, you want to know whether the strategy has generated positive results historically.
However, don’t stop there.
A return of 100% means very little without knowing:
- Over what period?
- With how much drawdown?
- Using how much leverage?
- With how many trades?
- With what level of volatility?
Compare returns over the same period whenever possible.
A trader generating 50% in five years is very different from a trader generating 50% in three months.
Analyze Maximum Drawdown
Maximum drawdown is one of the most important metrics in copy trading.
It measures the largest decline from a previous account peak to a subsequent low.
For example:
An account grows from $10,000 to $15,000.
It then falls to $12,000.
The drawdown from the peak is 20%.
This matters because you will potentially experience similar losses when copying the strategy.
Consider:
Trader A
+100% return
-45% maximum drawdown
Trader B
+50% return
-10% maximum drawdown
Trader A made more money historically.
But the strategy also experienced significantly greater losses along the way.
For many investors, Trader B could be the more attractive option.
Compare Return With Drawdown
A simple way to improve your selection process is to compare historical return with maximum drawdown.
For example:
| Trader | Return | Maximum Drawdown |
|---|---|---|
| A | +120% | -50% |
| B | +70% | -20% |
| C | +40% | -8% |
Instead of asking:
“Who made the most money?”
ask:
“Who generated a reasonable return relative to the risk?”
This is a much more useful question.
Check the Recovery Time
Drawdown size isn’t the only factor.
You should also look at how long the trader takes to recover from losses.
Suppose two traders both experience a 10% drawdown.
Trader A recovers within one month.
Trader B takes twelve months.
The maximum drawdown is identical.
But the trading experience is very different.
Long recovery periods can indicate that the strategy struggles in certain market conditions.
Examine Monthly Performance
A profitable trader doesn’t necessarily need to make money every month.
Losses are a normal part of trading.
What you want to see is how the strategy behaves over time.
For example:
| Month | Trader A | Trader B |
|---|---|---|
| January | +5% | +2% |
| February | -12% | +1% |
| March | +18% | -2% |
| April | -9% | +3% |
| May | +20% | +2% |
| June | -15% | -1% |
Trader A might produce a higher overall return.
But Trader B shows a much more controlled pattern.
Neither is automatically better.
The choice depends on your risk tolerance.
The key is understanding the behavior of the strategy.
Consistency Matters
Consistency is often overlooked because large returns attract more attention.
A trader generating 5% every month may be more predictable than one generating:
+50%
-30%
+60%
-20%
Even if both produce a positive overall result.
A consistent strategy may be easier to follow psychologically.
This matters because one of the biggest mistakes in copy trading is abandoning a strategy during a temporary drawdown.
If you choose a strategy that regularly experiences massive fluctuations, you may be tempted to stop copying at precisely the wrong time.
Look at the Number of Trades
The number of trades can provide useful context.
A trader who has executed:
2,000 trades
has generated a very different statistical sample from one who has executed:
12 trades.
A small number of trades can produce unusually high or low returns by chance.
A larger sample provides more information about the strategy’s behavior.
However, more trades don’t automatically mean better performance.
High-frequency trading can also increase:
- Spreads
- Commissions
- Slippage
- Execution costs
Therefore, trading frequency should always be considered alongside profitability.
Understand the Trading Strategy
Before copying a profitable trader, find out what they actually do.
Common copy trading strategies include:
- Trend following
- Swing trading
- Day trading
- Scalping
- Momentum trading
- Breakout trading
- Mean reversion
- Grid trading
- Algorithmic trading
- News trading
The strategy determines how the trader is likely to behave under different market conditions.
For example, a trend-following strategy may perform strongly during directional markets but struggle during sideways conditions.
A mean-reversion strategy may work well in ranges but struggle when a strong trend develops.
Understanding the strategy helps you determine whether historical performance makes sense.
Check What Markets the Trader Trades
Market selection is another important factor.
A trader might specialize in:
- Forex
- Gold
- Nasdaq
- Stock indices
- Individual stocks
- Commodities
- Cryptocurrencies
A trader focused entirely on one market may have significantly different risk from a trader who diversifies across several asset classes.
However, diversification isn’t automatically safer.
Several indices may all move in the same direction during a major market event.
Look at the actual correlation between positions rather than simply counting how many markets the trader trades.
Analyze Leverage
Leverage can dramatically increase both profits and losses.
Two traders might generate identical returns while using completely different levels of leverage.
For example:
Trader A: +40% using moderate exposure
Trader B: +40% using extremely high leverage
The headline performance is identical.
The underlying risk isn’t.
When searching for profitable traders to copy, check whether the platform provides information about:
- Leverage
- Margin usage
- Position size
- Exposure
A high-return strategy that relies heavily on leverage deserves additional scrutiny.
Watch Position Sizing
Position sizing can tell you a lot about a trader’s risk management.
A disciplined trader may use relatively consistent position sizes based on predefined risk.
A more aggressive trader may dramatically increase position sizes after winning or losing trades.
Pay particular attention to what happens after losses.
If position sizes increase significantly following losing trades, investigate whether the trader uses:
- Martingale
- Averaging down
- Grid strategies
- Recovery systems
These strategies can produce impressive short-term statistics while creating substantial tail risk.
Be Careful With Martingale Strategies
Martingale is one of the biggest red flags when looking for profitable traders to copy.
The basic concept is to increase the size of the next position after a loss.
The strategy assumes that a future winning trade can recover previous losses.
The problem is that losing streaks can continue longer than expected.
Position sizes can then grow rapidly.
A strategy that has won 90% of its trades can still experience catastrophic losses if the 10% of losing trades occurs consecutively and position sizing escalates.
Therefore, never evaluate a trader solely by their win rate.
Win Rate Is Not Enough
Suppose Trader A wins 90% of trades.
Sounds excellent.
But their average winning trade is $10 while their average losing trade is $200.
Ten winning trades generate:
$100
One losing trade costs:
$200
The strategy loses money despite the impressive win rate.
Now consider another trader with a 45% win rate but an average winner of $300 and average loser of $100.
The second trader can be profitable despite losing more than half of their trades.
This is why you should look at the relationship between average wins and average losses, not simply the percentage of winning trades.
Check the Profit Factor
If a platform provides a profit factor, it can be a useful statistic.
The basic concept is:
Gross profits ÷ gross losses
For example:
Gross profits: $30,000
Gross losses: $20,000
Profit factor:
1.50
A profit factor above 1 indicates that gross profits exceeded gross losses during the period measured.
But again, no single metric should determine your decision.
A high profit factor based on a very short track record isn’t necessarily meaningful.
Look at Risk-Adjusted Returns
One of the strongest ways to compare traders is to consider the return relative to the risk taken.
Metrics such as the Sharpe ratio can provide additional context by comparing returns with volatility.
Other measures may include:
- Sortino ratio
- Calmar ratio
- Maximum drawdown
- Recovery factor
Not every copy trading platform provides all of these statistics.
If they are available, they can help you move beyond simple return rankings.
Check the Current Drawdown
Historical statistics aren’t enough.
You should also look at the trader’s current situation.
Imagine a trader has:
+80% historical return
10% historical maximum drawdown
But is currently down 9%.
That’s very different from a trader currently down 2%.
The current drawdown tells you where the strategy is in its cycle.
It can also help you understand whether you are entering after a large run-up or during a recovery period.
Don’t Ignore Open Positions
Open positions are extremely important.
A trader might show a profitable account while holding significant unrealized losses.
For example:
Account balance: $20,000
Equity: $15,000
That means the account has approximately $5,000 in unrealized losses.
If you only look at the balance, you might miss the actual risk.
Whenever possible, review:
- Open trades
- Floating profit/loss
- Position sizes
- Margin
- Market exposure
This gives you a more realistic picture of current risk.
Look for Verified Performance
If possible, prioritize traders whose performance is based on verified trading accounts.
Verified data can help establish that the results come from actual trading activity rather than screenshots or manually reported figures.
However, verification doesn’t mean:
- The trader is profitable in the future
- The strategy is low risk
- The trader is professionally qualified
- Your capital is protected
- The trader is regulated
It simply increases transparency around the historical data.
Avoid Traders With Very Short Track Records
One of the most common mistakes is copying a trader because of a spectacular recent return.
For example:
+150% in 60 days
This sounds incredible.
But it doesn’t tell you how the trader would perform over several years.
A short track record can be heavily influenced by market conditions.
The trader may have simply benefited from a specific opportunity.
Look for sufficient historical data before drawing conclusions.
Don’t Confuse Recent Performance With Skill
Imagine a trader generates +80% during a strong market rally.
Was that skill?
Possibly.
But the same trader might have generated -30% during the previous sideways market.
This is why you should analyze performance across different market environments.
A strategy that works only in one specific condition may not be suitable for long-term copying.
Analyze the Trader’s Worst Periods
Don’t just look at the best months.
Look at the worst ones.
Ask:
- What caused the losses?
- How large were they?
- How long did recovery take?
- Did position sizing change?
- Did the trader change strategy?
- Was leverage increased?
The worst period often tells you more about a trader’s risk management than the best period.
Consider the Trader’s Trading Frequency
Different traders require different levels of monitoring.
A scalper might execute dozens of trades per day.
A swing trader might make only a few trades per month.
Neither is inherently better.
But high-frequency strategies can be more sensitive to:
- Spreads
- Slippage
- Commissions
- Execution speed
If you’re copying trades automatically, execution differences between the provider and follower can affect results.
Copy Trading With Low Drawdown
If your priority is capital preservation, you may want to specifically search for traders with relatively low historical drawdown.
For example:
Trader A
+100% return
-45% drawdown
Trader B
+40% return
-8% drawdown
Trader C
+60% return
-15% drawdown
Trader B might be attractive to someone prioritizing stability.
Trader C may appeal to someone willing to accept more risk.
Trader A is the most aggressive.
There is no universal winner.
The best choice depends on your own risk tolerance.
Diversify Across Strategies
Instead of copying one trader, some investors choose multiple traders with different approaches.
For example:
- Trend-following trader
- Swing trader
- Gold specialist
- Multi-market trader
The objective is to avoid having your entire portfolio depend on one strategy.
But remember:
More traders do not automatically mean more diversification.
If all four traders take similar positions, they may all lose at the same time.
How to Find Profitable Traders to Copy: A Step-by-Step Process
Here is a practical selection process.
Step 1: Define Your Risk Level
Before searching, decide how much drawdown you can realistically tolerate.
Step 2: Filter for a Meaningful Track Record
Avoid making decisions based entirely on a few weeks of performance.
Step 3: Compare Returns
Look at long-term performance rather than one exceptional month.
Step 4: Analyze Maximum Drawdown
Determine how much risk was historically required to generate those returns.
Step 5: Check Consistency
Review monthly or quarterly performance.
Step 6: Understand the Strategy
Know whether the trader uses swing trading, scalping, trend following or another approach.
Step 7: Analyze Leverage
Determine how much exposure the trader uses.
Step 8: Check Position Sizing
Look for aggressive increases after losses.
Step 9: Review Current Positions
Understand what you’re potentially copying today.
Step 10: Compare Several Traders
Never rely on a single leaderboard ranking.
A Simple Copy Trader Evaluation Table
You can use a scoring system when comparing traders:
| Factor | Trader A | Trader B | Trader C |
|---|---|---|---|
| Track Record | 2 years | 4 years | 8 months |
| Return | 85% | 48% | 120% |
| Max Drawdown | 28% | 9% | 42% |
| Leverage | High | Moderate | Very High |
| Consistency | Medium | High | Low |
| Strategy | Scalping | Swing | Grid |
| Risk Level | High | Moderate | Very High |
In this example, Trader C has the highest return.
But Trader B may be the more balanced choice.
This illustrates why a good selection process shouldn’t simply rank traders by return.
What Is the Best Return-to-Risk Profile?
There is no universal ideal ratio.
However, you generally want to see a reasonable relationship between:
Return
and
Drawdown.
For example, a strategy generating 30% with a 5% drawdown may deserve closer attention than a strategy generating 30% with a 30% drawdown.
Again, historical statistics aren’t guarantees.
But they can help you compare strategies more intelligently.
Questions to Ask Before Copying a Trader
Before committing capital, ask:
How long has this trader been profitable?
What was the worst drawdown?
How long did recovery take?
What markets are traded?
What strategy is used?
How much leverage is used?
How large are individual positions?
Does the trader use martingale or averaging?
How many trades have been executed?
What are the current open positions?
Is the performance independently verified?
What fees and trading costs apply?
If you cannot answer these questions, you don’t yet know enough about the trader.
Common Mistakes When Choosing Profitable Traders
Chasing the Highest Return
High returns can come with extreme risk.
Ignoring Drawdown
A strategy can be profitable and still experience severe losses.
Focusing on Win Rate
A high win rate doesn’t guarantee profitability.
Ignoring Leverage
Leverage can dramatically amplify losses.
Copying Too Quickly
A few successful weeks don’t establish a long-term track record.
Ignoring Current Positions
Historical statistics don’t show everything happening today.
Copying Too Many Similar Traders
Several traders can still have the same underlying market exposure.
Stopping During Every Drawdown
Normal losing periods are part of trading.
Believing Guarantees
No legitimate trading strategy can guarantee future profits.
How Much Should You Invest in a Profitable Copy Trader?
There is no universal amount.
The appropriate allocation depends on:
- Your financial situation
- Your risk tolerance
- Your overall portfolio
- The strategy’s volatility
- Maximum drawdown
- Your investment horizon
The most important principle is:
Never allocate money you cannot afford to lose.
This is particularly important when copying leveraged trading strategies.
How Often Should You Review a Copy Trader?
You don’t necessarily need to monitor every trade.
However, periodic reviews are useful.
Check whether:
- Performance remains consistent
- Drawdown remains within expectations
- Leverage changes
- Position sizes increase
- The strategy changes
- Market exposure changes
The goal is not to interfere with every trading decision.
It’s to make sure the strategy still matches the reason you selected it.
Conclusion: How to Find Profitable Traders to Copy
Learning how to find profitable traders to copy isn’t about finding the trader with the biggest percentage return.
It’s about identifying traders who have demonstrated consistent historical performance while maintaining a level of risk that fits your objectives.
Start with the track record.
Then analyze return, maximum drawdown, consistency, recovery time, leverage, position sizing, strategy and current exposure.
Don’t rely on a high win rate or an impressive leaderboard position. Investigate whether the trader uses aggressive techniques such as martingale, grid systems or averaging down.
Where possible, prioritize verified trading data and look for a meaningful history rather than relying on screenshots or recent performance.
Most importantly, understand the strategy before you copy it.
A trader who generated 50% with a 10% drawdown is fundamentally different from one who generated 50% with a 40% drawdown.
The objective isn’t simply to find a trader who made money.
The objective is to find a trader whose historical performance, strategy and risk profile make sense for you.
That distinction can help you avoid chasing short-term performance and build a more disciplined approach to copy trading.
Overview of Topics