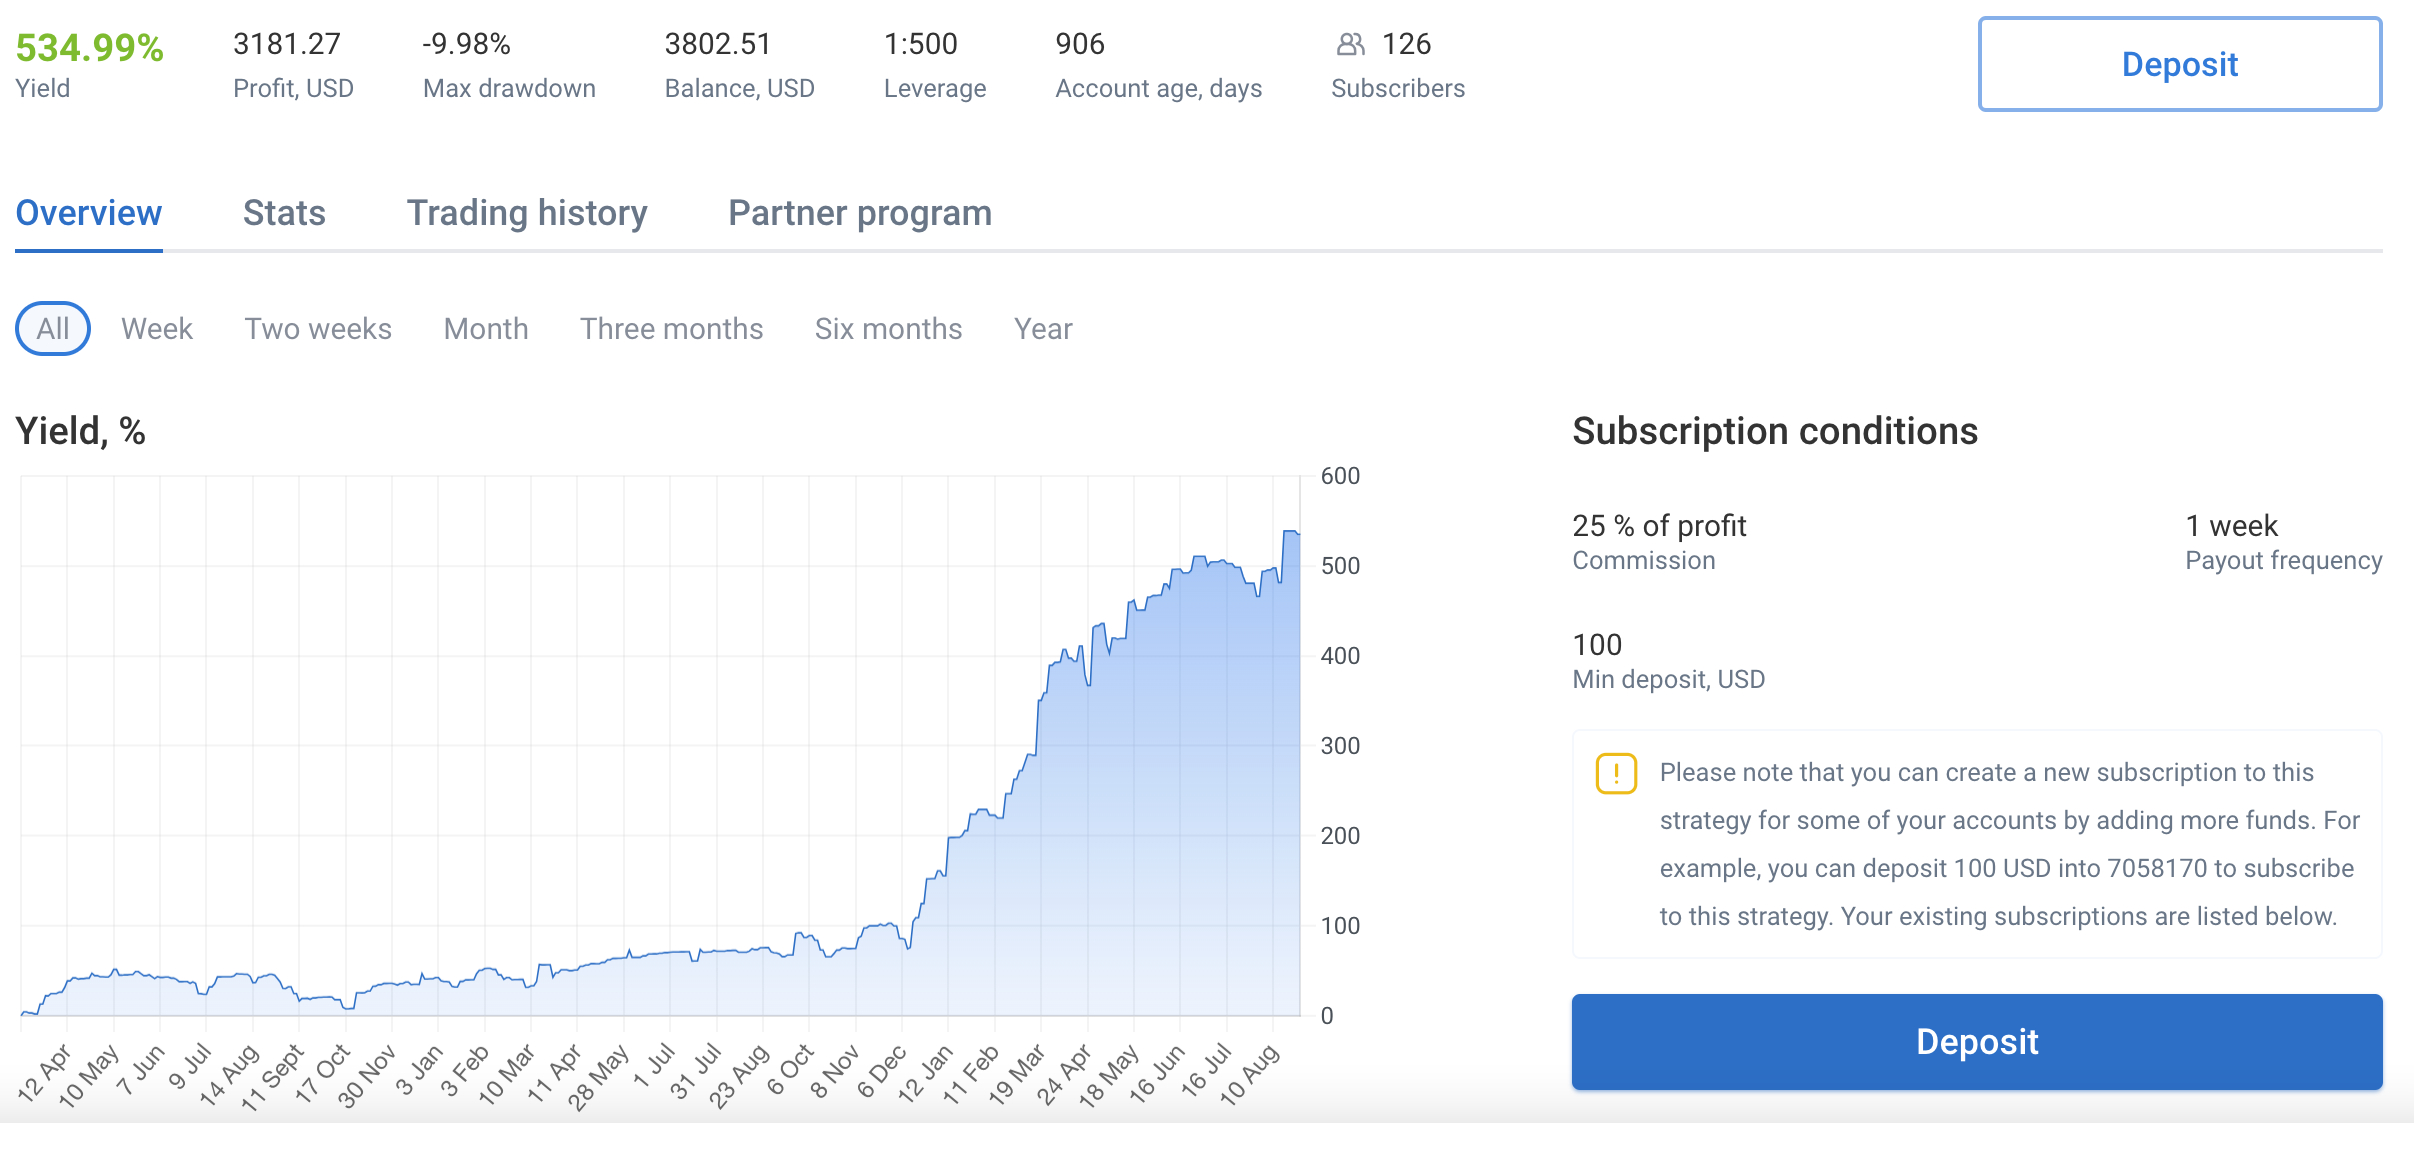
Copy trading with low drawdown is particularly attractive to investors who want to participate in financial markets without accepting the extreme fluctuations associated with highly aggressive trading strategies.
When comparing copy traders, many investors initially focus on returns. A trader showing +100%, +200% or even higher returns can quickly attract attention. However, the return alone doesn’t tell you how much risk was required to achieve it.
A strategy that generates +100% while experiencing a 50% drawdown is fundamentally different from a strategy that generates +30% with a maximum drawdown of 5%.
This is why drawdown is one of the most important metrics to analyze before selecting a copy trader.
A low-drawdown strategy does not mean a risk-free strategy. Every trading strategy can lose money, and historical drawdown does not predict the maximum loss that could occur in the future.
However, looking for controlled historical drawdowns can help investors compare strategies more intelligently and avoid focusing exclusively on headline returns.
What Is Drawdown in Copy Trading?
Drawdown measures the decline of an account or strategy from a previous peak.
Imagine a copy trading account starts with $10,000.
The account increases to $12,000.
It then falls to $11,000.
The drawdown from the $12,000 peak is $1,000, or approximately 8.3%.
If the account later reaches $13,000, the previous drawdown has been recovered and the strategy has reached a new high.
This is different from simply looking at whether the account is profitable overall.
A strategy could be up 30% over a year while experiencing several significant drawdowns along the way.
For copy trading, understanding these temporary losses is crucial because you experience the drawdown in your own account as well.
What Is Maximum Drawdown?
Maximum drawdown, often abbreviated as MDD, is the largest peak-to-trough decline recorded during a particular period.
For example:
- Starting capital: $10,000
- Account peak: $15,000
- Subsequent low: $12,000
- Maximum drawdown: $3,000
- Maximum drawdown: 20%
The maximum drawdown tells you how severe the historical worst decline was.
It is one of the most useful statistics when comparing copy traders.
However, it should never be interpreted as a guarantee.
If a strategy has historically experienced a maximum drawdown of 10%, it does not mean that future drawdowns cannot reach 15%, 20% or more.
Markets can behave differently in the future.
Why Low Drawdown Matters in Copy Trading
Drawdown matters because it directly affects both your capital and your psychology.
Suppose you copy two traders.
Trader A
- Annual return: +80%
- Maximum drawdown: -35%
Trader B
- Annual return: +30%
- Maximum drawdown: -7%
Trader A generated significantly more profit.
But you also had to tolerate a much larger temporary loss.
If you invested $10,000, a 35% drawdown represents a decline of approximately $3,500.
A 7% drawdown represents approximately $700.
The difference can be enormous from an investor’s perspective.
A strategy with a lower drawdown may therefore be more suitable for someone who prioritizes capital stability over maximum returns.
Is Copy Trading With Low Drawdown Risk-Free?
No.
This is one of the most important points to understand.
Low historical drawdown doesn’t mean low future risk.
A trader may have experienced only a 5% drawdown over several years and then encounter a market environment that produces a much larger loss.
Historical statistics describe what happened in the past.
They don’t guarantee what happens next.
Therefore, copy trading with low drawdown should be understood as a risk-selection approach, not a risk-elimination method.
The objective is to identify strategies that have historically maintained relatively controlled losses.
Low Drawdown vs. High Returns
Investors often face a trade-off between return and risk.
Consider these three strategies:
| Strategy | Return | Maximum Drawdown |
|---|---|---|
| Trader A | +120% | -50% |
| Trader B | +55% | -15% |
| Trader C | +25% | -5% |
Trader A clearly has the highest return.
But it also experienced the largest drawdown.
Trader C generated the lowest return but had the smallest historical drawdown.
Trader B sits between the two.
There is no universally correct choice.
The right strategy depends on how much risk you are willing to accept.
For many investors, Trader B might offer a more balanced risk-return profile than simply choosing the trader with the highest return.
Don’t Judge a Trader by Maximum Drawdown Alone
Low maximum drawdown is valuable information, but it isn’t enough by itself.
A trader might show an unusually low drawdown because:
- The track record is very short
- Few trades have been executed
- The trader currently has large floating losses
- Risk is hidden in open positions
- The strategy uses averaging
- The strategy hasn’t experienced a difficult market environment yet
You therefore need to examine the broader picture.
Look at:
- Track record
- Maximum drawdown
- Average drawdown
- Recovery time
- Leverage
- Position sizing
- Open positions
- Trading frequency
- Strategy type
- Market exposure
Track Record Is Essential
Suppose one copy trader has a maximum drawdown of only 3%.
That sounds excellent.
But then you discover the strategy has existed for only two months.
Another trader has a 7% maximum drawdown over five years.
Which one provides more information?
The second strategy.
A longer track record allows you to see how the trader performed across different market conditions.
This doesn’t make the strategy automatically safer.
But it gives you more evidence.
When searching for copy trading with low drawdown, low drawdown plus a meaningful track record is much more informative than low drawdown alone.
Look at Drawdown Duration
The size of the drawdown isn’t the only factor.
You should also look at how long the strategy takes to recover.
Imagine two traders both experience a 10% drawdown.
Trader A recovers within two weeks.
Trader B takes eight months to return to the previous high.
The maximum drawdown is identical.
The experience is very different.
Recovery time can therefore provide valuable additional information.
A prolonged drawdown can also increase the psychological pressure on investors.
What Is Recovery From Drawdown?
Suppose a strategy falls by 50%.
It might seem logical that it only needs to gain 50% to recover.
But that’s incorrect.
If you start with $10,000 and lose 50%, you’re left with $5,000.
To return from $5,000 to $10,000, you need a 100% gain.
This demonstrates why large drawdowns can be so damaging.
| Drawdown | Gain Needed to Recover |
|---|---|
| 5% | 5.3% |
| 10% | 11.1% |
| 20% | 25% |
| 30% | 42.9% |
| 40% | 66.7% |
| 50% | 100% |
| 60% | 150% |
This is one reason why controlling downside risk is so important.
How to Find Copy Traders With Low Drawdown
When searching for a low-drawdown copy trader, start with the platform’s performance statistics.
Look for:
- Maximum drawdown
- Monthly performance
- Historical equity curve
- Risk score
- Average trade
- Number of trades
- Current open positions
Then investigate the underlying strategy.
A low drawdown should be the starting point for your analysis, not the final decision.
Check the Equity Curve
An equity curve shows how the account has developed over time.
A relatively smooth curve can indicate that the strategy has historically experienced fewer extreme fluctuations.
But don’t assume that a smooth curve automatically means low risk.
Some strategies can produce smooth results while accumulating large unrealized losses.
For example, averaging-down systems can keep the realized equity curve looking stable while floating losses increase.
Therefore, examine both:
Realized performance
and
Open exposure.
Be Careful With Floating Losses
Floating losses are unrealized losses on currently open trades.
They can be especially important when evaluating copy traders.
Imagine a strategy shows:
+20% return
but currently has several large losing positions.
If those positions are eventually closed, the reported performance could change dramatically.
This is why the current exposure of a copy trader matters.
If possible, examine:
- Open positions
- Current drawdown
- Margin usage
- Position sizes
- Exposure per instrument
A strategy can look safer than it actually is if you only look at closed trades.
Low Drawdown and Leverage
Leverage is one of the most important factors when evaluating risk.
A trader using very high leverage can generate large returns.
They can also experience substantial losses from relatively small market movements.
European regulators have specifically highlighted the risks of leveraged CFDs for retail investors. ESMA introduced restrictions on CFD leverage because of concerns about significant losses among retail clients.
Therefore, when looking for copy trading with low drawdown, ask:
“Is the low drawdown the result of genuine risk management, or simply a short period without a major adverse move?”
Leverage can remain hidden until the market moves sharply.
Avoid Excessive Position Sizes
Position sizing is another critical factor.
A trader who consistently risks similar amounts on each position may have a more predictable risk profile than someone who regularly changes position sizes dramatically.
For example:
Trade 1: 0.10 lots
Trade 2: 0.12 lots
Trade 3: 0.11 lots
Trade 4: 0.10 lots
This is very different from:
Trade 1: 0.10 lots
Trade 2: 0.20 lots
Trade 3: 0.50 lots
Trade 4: 1.50 lots
Large increases in position size can dramatically change the risk profile.
Be Careful With Martingale Strategies
One of the biggest red flags when looking for low-drawdown copy trading is martingale-style trading.
Martingale strategies increase position size after losses.
The idea is that a future winning trade will recover previous losses.
This can create:
- Very high win rates
- Long periods of small profits
- A smooth-looking equity curve
But it also creates a serious weakness.
A prolonged losing streak can cause position sizes to grow rapidly.
Eventually, the strategy may encounter:
- Margin limits
- Forced liquidation
- Massive drawdown
- Significant capital losses
A trader showing a 2% historical drawdown isn’t necessarily conservative if the strategy relies on a large amount of unrealized risk.
Grid Strategies and Low Drawdown
Grid strategies can also create misleadingly low historical drawdowns.
A grid system places multiple orders at predefined price levels.
When markets move within a range, the strategy may perform well.
But when price develops a strong directional trend, exposure can accumulate.
The result can be substantial floating losses.
When evaluating a grid trader, investigate:
- Maximum number of positions
- Maximum exposure
- Position sizing
- Leverage
- Stop-loss rules
- Historical stress periods
Don’t assume that a high win rate means low risk.
Look at the Risk-Reward Relationship
A useful way to evaluate copy traders is to compare return with maximum drawdown.
For example:
Trader A: +50% return / -30% drawdown
Trader B: +35% return / -10% drawdown
Trader A generated more profit.
But Trader B required considerably less historical drawdown.
This doesn’t mean Trader B is guaranteed to perform better in the future.
It means the historical relationship between return and drawdown was different.
That’s valuable information.
What Is a Good Drawdown for Copy Trading?
There is no universal number that defines a “good” drawdown.
Some investors might consider:
- Below 5% very conservative
- 5–10% relatively controlled
- 10–20% moderate
- 20–30% aggressive
- Above 30% very aggressive
But these are only rough categories, not universal standards.
A Forex scalping strategy, long-term stock strategy and leveraged CFD strategy cannot be judged using exactly the same expectations.
The important question is:
Does the drawdown make sense relative to the strategy’s expected return and trading approach?
Copy Trading With Low Drawdown vs. Low Risk
These terms should not be confused.
Low drawdown describes historical performance.
Low risk is a broader concept.
A strategy may have a low historical drawdown but still carry substantial risks because of:
- High leverage
- Concentrated positions
- Low liquidity
- Large open losses
- Short track record
- Tail-risk events
Therefore, don’t use “low drawdown” as a synonym for “safe.”
How Much Capital Should You Allocate?
Finding a low-drawdown trader doesn’t mean you should invest your entire available capital.
Risk management also depends on position size at the portfolio level.
Suppose a strategy historically has a 10% maximum drawdown.
If you allocate 100% of your capital to it, a similar drawdown could affect your entire account.
If you allocate 20%, the effect on your total portfolio is substantially smaller, assuming the remaining capital is not exposed to the same risk.
The exact allocation should depend on your financial circumstances and risk tolerance.
Diversification Can Reduce Concentration
One approach is to spread capital between different strategies.
For example:
- 30% trend-following strategy
- 25% swing trading
- 20% lower-volatility strategy
- 25% held outside copy trading
The exact allocation is individual.
The principle is more important:
Don’t assume that one trader represents an entire investment strategy.
However, diversification only helps if the strategies actually have different exposures.
Three traders who all trade highly leveraged Nasdaq positions are not meaningfully diversified simply because there are three names on your account.
Correlation Between Copy Traders
Correlation is often overlooked.
Imagine you copy:
- Trader A: Nasdaq long
- Trader B: S&P 500 long
- Trader C: DAX long
These appear to be three different traders.
But during a broad equity-market sell-off, all three strategies could potentially suffer at the same time.
Your portfolio may therefore be more concentrated than it appears.
When building a copy trading portfolio, look at the underlying market exposure, not just the number of traders.
Low Drawdown Does Not Mean Low Return
It is possible to build strategies that aim for relatively controlled drawdowns without eliminating the possibility of meaningful returns.
However, there is generally no free combination of:
- Extremely high returns
- Extremely low drawdowns
- Very high win rate
- No leverage risk
- No volatility
If someone promises all of these simultaneously, you should investigate very carefully.
Financial markets involve uncertainty.
Higher expected returns generally come with some form of additional risk.
Why Some Traders Have Extremely Low Drawdown
If you find a trader with:
+60% return
and
1% maximum drawdown
don’t immediately assume you’ve found the perfect strategy.
Ask why.
Possible explanations include:
- Short track record
- Favorable market conditions
- Hidden floating losses
- Very small position sizes
- Aggressive recovery methods
- Limited historical data
- Strategy changes
The number itself doesn’t tell you the story.
The underlying trading behavior does.
How to Evaluate a Low-Drawdown Copy Trader
Use this checklist:
1. Track Record
How many months or years of data are available?
2. Maximum Drawdown
What was the largest historical peak-to-trough decline?
3. Recovery Time
How quickly did the strategy recover?
4. Current Drawdown
Where is the strategy today?
5. Leverage
How much exposure is being used?
6. Position Sizes
Are positions consistent?
7. Open Positions
Are there significant unrealized losses?
8. Strategy
Is the approach clear and understandable?
9. Market Exposure
Which assets are being traded?
10. Risk Management
What happens when the strategy is wrong?
The Importance of Consistency
A trader doesn’t need to make money every week to have a good strategy.
What matters is how the strategy behaves over a sufficiently long period.
For example:
| Month | Return |
|---|---|
| January | +2.1% |
| February | +1.5% |
| March | -1.2% |
| April | +2.8% |
| May | +1.1% |
| June | -0.8% |
This can represent a relatively controlled trading profile.
Compare that with:
| Month | Return |
|---|---|
| January | +25% |
| February | -18% |
| March | +30% |
| April | -25% |
| May | +40% |
| June | -20% |
The second strategy might still generate a positive return overall.
But the experience and risk are completely different.
What Should You Do During a Drawdown?
A drawdown doesn’t automatically mean you should stop copying a trader.
Every strategy experiences losing periods.
Instead, ask whether the current drawdown is consistent with the strategy’s historical behavior.
For example:
Historical maximum drawdown: 8%
Current drawdown: 7%
That may be within the historical range.
But:
Historical maximum drawdown: 8%
Current drawdown: 25%
That requires significantly more investigation.
The strategy may have fundamentally changed.
When Should You Stop Copying a Trader?
There is no universal rule.
However, you should reconsider a strategy if:
- Risk increases substantially
- Leverage changes dramatically
- Position sizes become much larger
- The trader changes strategy
- Drawdown exceeds your predefined limit
- The trader starts using martingale
- Market exposure changes significantly
Don’t wait until emotions take over.
Define your risk limits before you start copying.
Low Drawdown Copy Trading and Psychology
One of the biggest advantages of a lower-drawdown strategy can be psychological.
A trader who experiences a 5% drawdown may be easier for an investor to follow than one experiencing a 40% drawdown.
This matters because investor behavior can significantly affect results.
You might select an aggressive strategy because of its historical return.
Then, after a 30% decline, you panic and stop copying.
The trader subsequently recovers.
You have realized the loss while the original strategy eventually returned to profitability.
A strategy you can actually stick with may therefore be more valuable than one that looks better on paper but is psychologically impossible for you to follow.
The Best Copy Trading Strategy Is Not Necessarily the Highest Return
This is the key principle.
When comparing copy traders, don’t ask:
“Who made the most money?”
Instead ask:
“Who generated reasonable returns while keeping risk within a range I can tolerate?”
This changes the entire selection process.
You stop chasing leaderboard performance and start analyzing risk.
Conclusion: Copy Trading With Low Drawdown
Copy trading with low drawdown can be an attractive approach for investors who want to focus on controlled risk rather than simply chasing the highest possible returns.
However, low historical drawdown should never be interpreted as a guarantee of future safety.
When evaluating a copy trader, look beyond the headline return. Analyze the maximum drawdown, track record, recovery time, leverage, position sizing, open exposure, trading strategy and risk management.
Be particularly cautious with strategies that rely on martingale systems, aggressive averaging or large floating losses. These approaches can make historical performance appear much safer than the underlying risk actually is.
A strong copy trading strategy isn’t necessarily the one that produces the biggest monthly return.
It may be the one that delivers consistent performance while keeping losses within a range you can realistically tolerate.
Ultimately, the goal isn’t to eliminate drawdown. That’s impossible in trading.
The goal is to understand it, manage it and choose a strategy where the potential return is appropriate for the risk you are taking.
Low drawdown is not the same as no risk. But understanding drawdown is one of the most important steps toward making a more informed copy trading decision.
Overview of Topics
- What Is Drawdown in Copy Trading?
- What Is Maximum Drawdown?
- Why Low Drawdown Matters in Copy Trading
- Is Copy Trading With Low Drawdown Risk-Free?
- Low Drawdown vs. High Returns
- Don’t Judge a Trader by Maximum Drawdown Alone
- Track Record Is Essential
- Look at Drawdown Duration
- What Is Recovery From Drawdown?
- How to Find Copy Traders With Low Drawdown
- Check the Equity Curve
- Be Careful With Floating Losses
- Low Drawdown and Leverage
- Avoid Excessive Position Sizes
- Be Careful With Martingale Strategies
- Grid Strategies and Low Drawdown
- Look at the Risk-Reward Relationship
- What Is a Good Drawdown for Copy Trading?
- Copy Trading With Low Drawdown vs. Low Risk
- How Much Capital Should You Allocate?
- Diversification Can Reduce Concentration
- Correlation Between Copy Traders
- Low Drawdown Does Not Mean Low Return
- Why Some Traders Have Extremely Low Drawdown
- How to Evaluate a Low-Drawdown Copy Trader
- The Importance of Consistency
- What Should You Do During a Drawdown?
- When Should You Stop Copying a Trader?
- Low Drawdown Copy Trading and Psychology
- The Best Copy Trading Strategy Is Not Necessarily the Highest Return
- Conclusion: Copy Trading With Low Drawdown
- Follow Verified Traders Now